
Observability Cost Is an Architecture Decision, Not Just a Vendor Bill
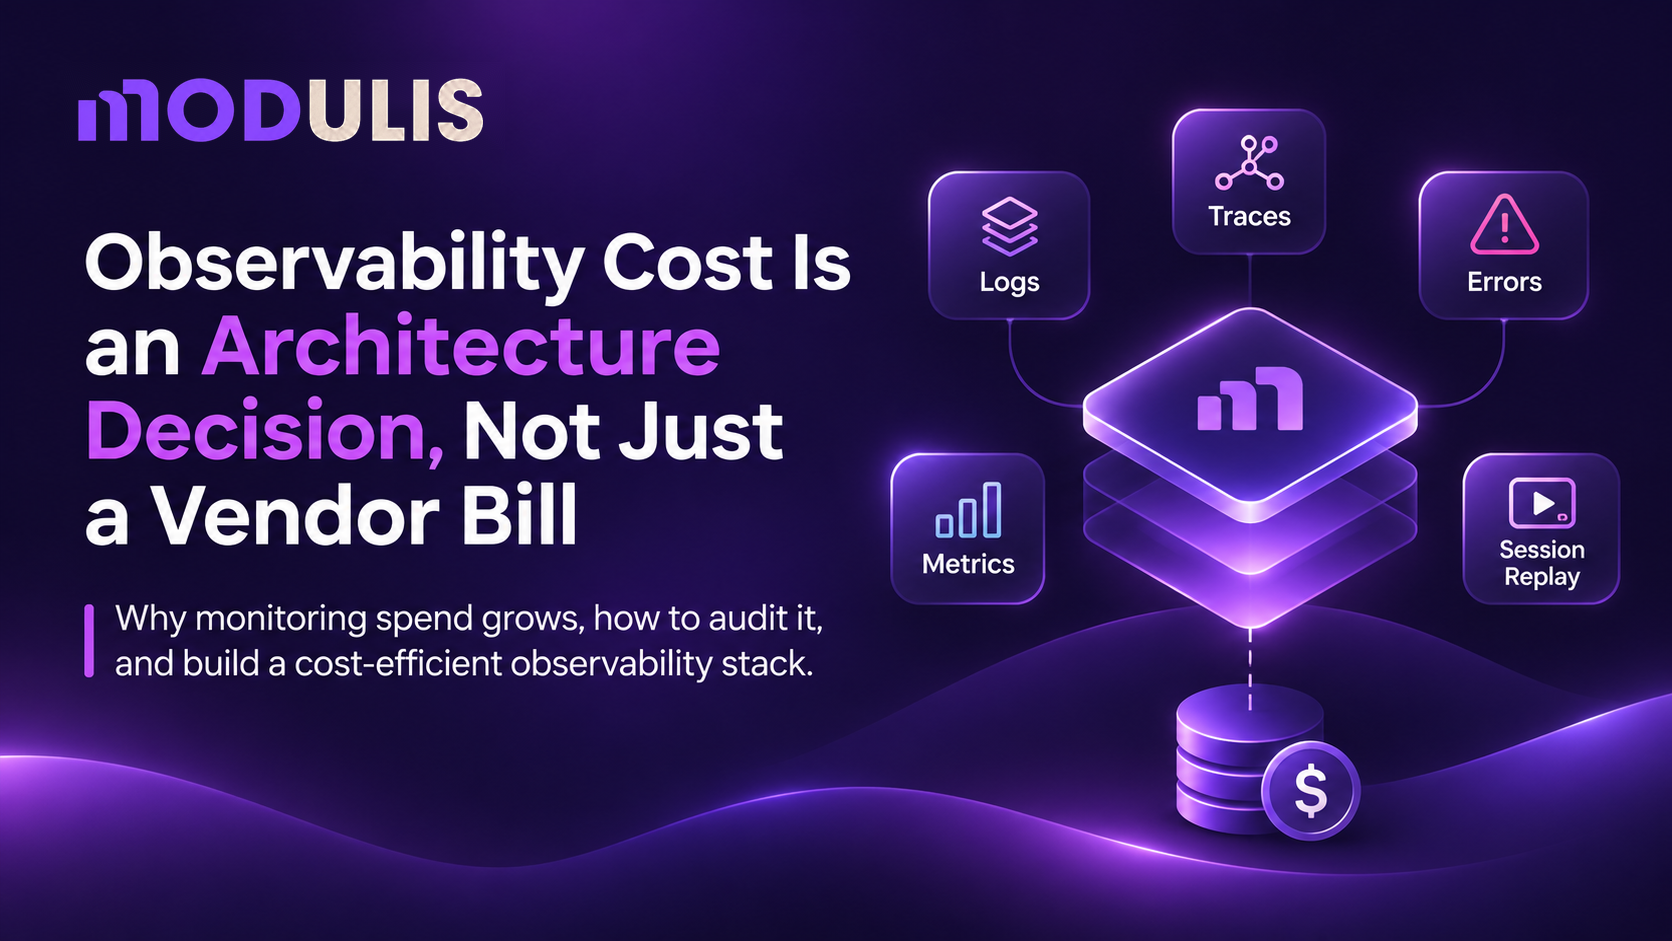
Observability is usually introduced to solve an engineering problem: understand what's happening inside an application, identify failures and investigate production issues.
As systems grow, however, observability introduces an economic problem of its own.
A new service emits logs. Instrumentation adds spans. Engineers introduce additional metrics. Session replay and product analytics provide more insight into user behaviour.
Individually, these decisions make sense. Collectively, they can create a monitoring bill that grows faster than the application itself.
This is why observability cost should be considered part of system architecture.
1. Understand what your observability stack charges for
There isn't a single pricing model across observability products.
Different platforms charge according to different consumption dimensions:
| Billing dimension | What drives consumption |
|---|---|
| Log ingestion | Volume of logs collected |
| Trace ingestion | Number or volume of spans |
| Infrastructure monitoring | Hosts or monitored resources |
| User licensing | Number of seats |
| Retention | How long telemetry is stored |
The important distinction is that application traffic and telemetry volume are not the same thing.
A service can receive a similar number of requests while generating more telemetry because of changes in logging verbosity, instrumentation or the number of monitored components.
For example, enabling more detailed logs during debugging can increase ingestion. Adding services introduces additional telemetry sources. Increasing the number of engineers may also affect seat-based subscriptions.
A pricing model tied to these dimensions can therefore make monthly costs less predictable.
2. Tool sprawl creates a fragmented cost structure
Another architectural decision that affects observability spend is how many separate products are used.
An engineering team might operate:
- An APM or infrastructure monitoring platform.
- A separate log management system.
- An error tracking tool.
- A session replay product.
- A product analytics platform.
Each solves a real problem, but the overall setup introduces multiple subscriptions and separate data models.
It also creates an investigation problem.
An engineer investigating a failed request may need to move between the error tracker, logs, traces, session replay and Git history.
The team is paying for each product independently while still doing manual work to connect the information.
The total cost is therefore not just the sum of vendor invoices. It also includes the engineering effort required to operate and reconcile the stack.
3. Why reducing telemetry isn't always a good optimization
When costs increase, reducing ingestion looks like the most direct solution.
Teams may lower log verbosity, reduce trace collection or shorten retention.
These changes can help, but they should be made carefully.
The telemetry that seems unnecessary during normal operations may be essential when an unusual production failure occurs.
An observability strategy should distinguish between data that is genuinely unnecessary and data that is expensive but important for debugging, reliability or compliance.
The goal is cost efficiency without losing the information needed to operate production systems.
4. A practical framework for auditing observability costs
Before choosing a different platform or rebuilding the telemetry pipeline, establish a baseline.
A. Inventory the stack
List every product used for logs, metrics, traces, infrastructure monitoring, error tracking, session replay and analytics.
For each product, document:
- What engineering problem it solves.
- Which services send data to it.
- Its pricing dimensions.
- Its retention configuration.
- Which teams use it.
B. Map consumption to architecture
Review telemetry consumption alongside the application architecture.
Ask:
- Which services generate the most logs?
- How does tracing volume change when new services are added?
- Did log verbosity change during recent debugging work?
- How many infrastructure resources are monitored?
- Are separate products collecting overlapping operational information?
The objective is to understand which architectural changes are contributing to the bill.
C. Include operational overhead
Subscription cost alone does not represent the full cost of observability.
Consider the time spent maintaining integrations, configuring separate dashboards, correlating signals and switching between products during incidents.
This is particularly relevant for smaller engineering teams, where observability maintenance competes directly with product development.
D. Compare pricing models
Evaluate the current usage-based model against alternatives such as flat subscriptions.
Don't compare only the headline subscription price.
Calculate the total expected cost, including infrastructure, storage, retention, support and any AI inference charges.
5. The different trade-off with BYOC and flat pricing
One alternative is a platform that combines multiple observability capabilities under a flat subscription.
Modulis follows this model. Its subscription is based on a monthly plan tier rather than per-GB ingestion pricing. Paid tiers include unlimited ingestion subject to fair use, and the platform combines logs, metrics, traces, error monitoring, session replay, product analytics and AI-assisted resolution.
It also uses Bring Your Own Cloud (BYOC): the platform runs inside the customer's cloud account.
This changes the cost structure, but it doesn't eliminate infrastructure expenses.
A realistic total-cost calculation includes:
- Platform subscription: The applicable Modulis plan.
- Cloud infrastructure: Compute and storage billed by the customer's cloud provider.
- AI inference: Model usage billed by the provider when Bring Your Own Key (BYOK) is used.
This separation makes the trade-off more explicit. Teams get subscription predictability, while retaining responsibility for their own cloud infrastructure and model costs.
It may not be the best economic choice for every low-volume workload. The right answer depends on current consumption, expected growth and operational requirements.
6. Treat observability as a platform-engineering concern
Observability is infrastructure for engineering teams. It deserves the same architectural attention as compute, storage and networking.
A useful approach is to review consumption regularly, understand the pricing dimensions, assign ownership and evaluate the complete toolchain rather than optimizing individual invoices in isolation.
The best outcome isn't simply a lower monitoring bill.
It is a production environment where engineers can investigate problems effectively without the cost of visibility becoming unpredictable.
Disclosure: This article is published by Modulis, an engineering observability and production-resolution platform.
Originally published at: https://modulis.ai/blog/monitoring-bill-grows-faster-than-traffic/
About the author
- Software Engineer -> Sales and Entrepreneurship
Comments
Join the discussionNo comments yet. Be the first to comment.